
Insurance
CHU Strata Index 2026: What 1,000 Owners Said About Maintenance, Strata Managers and Insurance
CHU surveyed 1,000 strata owners for its 2026 Strata Index. A third of schemes still have no regular maintenance plan, half of owners can't say what an insurance broker does, and 64% want to hear from their strata manager more often. Here are all 23 charts from the report and what a committee can take from them.
· 13 min read

On this pageStart hereOn this page
- Start here
- Who CHU asked, and what to keep in mind
- Maintenance: a third of schemes still have no plan
- Better maintenance, happier owners
- What owners like and dislike about strata
- Three types of owner
- Insurance brokers: trusted, but few owners know what they do
- Strata managers: rated on what owners can see
- What builds trust, and what breaks it
- Confidence in the sum insured
- What a committee can take from this
- What UnitBuddy tracks
- Sources and further reading
Start here
- The survey covered 1,000 strata lot owners aged 18 to 80 who are involved with their owners corporation, in different buildings across Australia. It is the second annual Index. The first came out in 2025.
- 64% of owners say their building has a regular maintenance action plan. That leaves about one scheme in three without one, the same as last year.
- Cost (45%) and getting the committee to agree (37%) are the biggest barriers to doing maintenance.
- Owners in well-maintained buildings are happier with their strata manager. 79% of owners in "perfectly maintained" buildings are very or extremely satisfied, against 64% where the building is somewhat or not well maintained.
- Half of owners misunderstand what an insurance broker does. One in five think the broker coordinates maintenance.
- 64% want more frequent communication from their strata manager. Only 8% want less.
- 73% are confident in the building's sum insured. Among the least engaged owners it's 43%.
Who CHU asked, and what to keep in mind
The respondents are owners who are "involved with their Owners Corporation". That probably means committee members and owners who go to meetings, not the owner who never opens the levy notice. So the numbers describe the more engaged end of the market. The real share of buildings without a maintenance plan is probably higher.
CHU applied quotas for state, scheme size, building value, management model and how the building buys insurance. The report doesn't publish the number of respondents in each subgroup, including the self-managed schemes and the three owner types it introduces. Treat the subgroup charts as directional.
CHU also has a commercial interest in some of the findings. It sells insurance through brokers, so a report concluding that brokers are undervalued is not surprising. The data is still useful. Just read the recommendations knowing who wrote them.
Some charts carry small letters next to the percentages, such as "g", "h" or "FG". These are the report's significance markers. They show which columns differ from each other by more than the survey's margin of error.
Maintenance: a third of schemes still have no plan
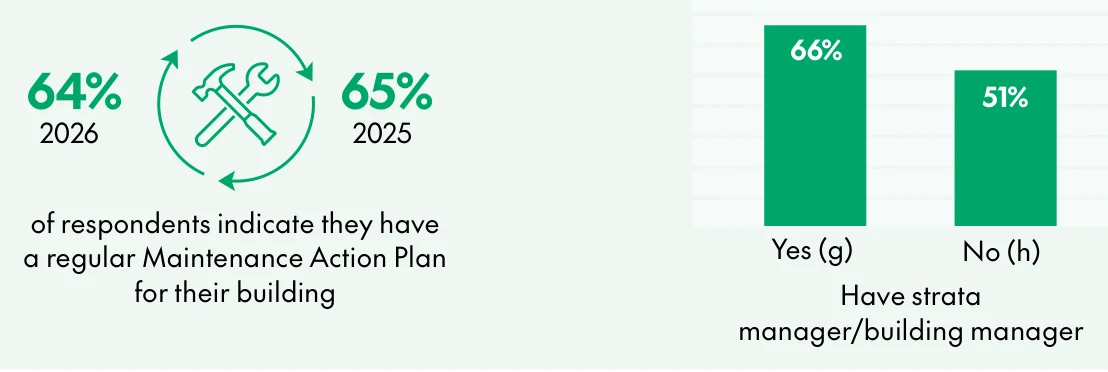
Figure 1.1: Schemes with a regular maintenance plan.
The headline number barely moved, 65% in 2025 and 64% in 2026. The gap between managed and self-managed schemes is the bigger story. Schemes with a strata manager or building manager are at 66%. Schemes with no professional help are at 51%.
That's not proof that a strata manager produces a plan. Bigger, more valuable buildings are more likely to have a manager and more likely to need a plan by law. But it does show that half of the schemes running without professional help also have no regular plan to check the building.
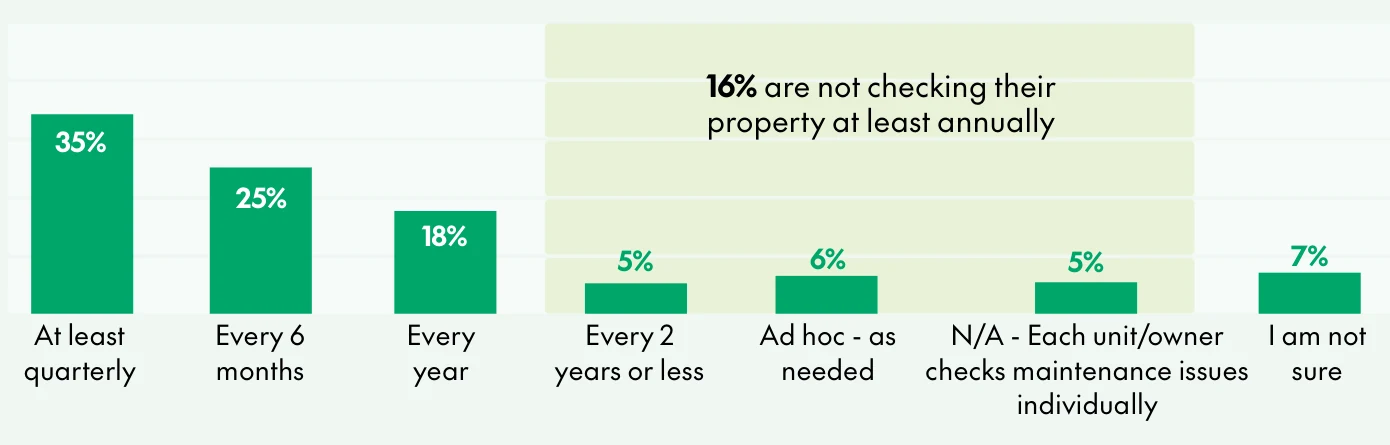
Figure 1.2: How often the building is checked for maintenance issues.
78% of owners say someone checks the building at least once a year. 16% say the building is checked every two years or less, only when something comes up, or by each owner for their own lot. That last group is worth a second look. If each owner checks only their own lot, nobody is checking the roof, the gutters, the basement drainage or the fire stairs. Those are common property, which is the owners corporation's job.
Another 7% don't know how often the building is checked. These are owners involved with their owners corporation, so that figure is higher than it should be.
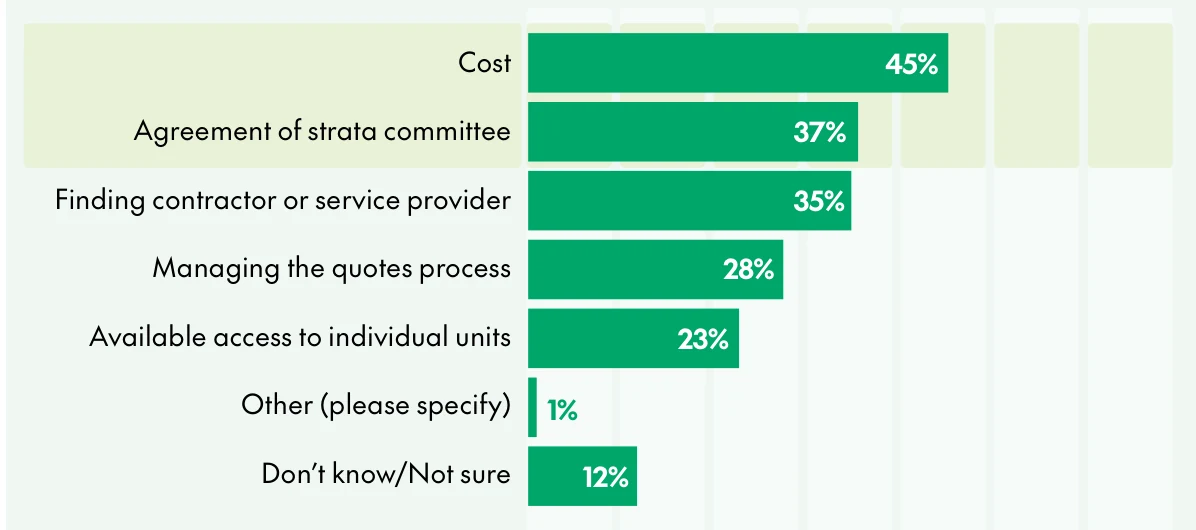
Figure 1.3: Barriers to carrying out maintenance.
Cost comes first, which nobody will be surprised by. Second is the committee itself. 37% say getting the committee to agree holds work up. Finding a tradesperson comes third at 35%.
CHU's suggestion for the committee problem is to approve a maintenance schedule instead of individual jobs, so the committee votes once on a system and doesn't argue every invoice. It's a good idea. A schedule with a budget attached, approved at the AGM, removes most of the reasons to stall a gutter clean in July.
Better maintenance, happier owners
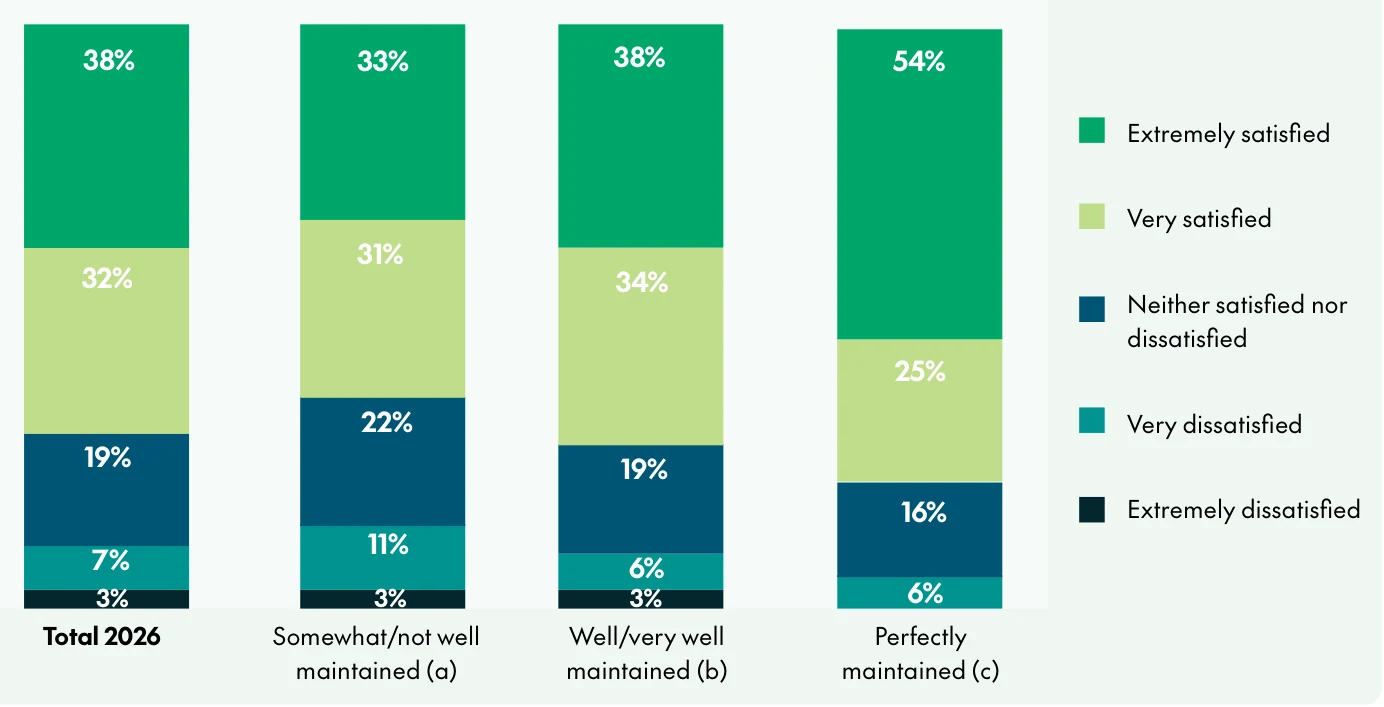
Figure 1.4: Satisfaction with the strata manager by how well the building is maintained.
Across all owners, 70% are very or extremely satisfied with their strata manager. In buildings described as perfectly maintained, 79% are. In buildings described as somewhat or not well maintained, 64% are.
The direction is clear. The size of the gap is smaller than you might expect, though. Nearly two-thirds of owners in poorly maintained buildings still rate their strata manager highly. Either those owners don't blame the manager for the building's condition, or they don't know what the manager should be doing about it. The report's later findings on role confusion suggest the second explanation is part of it.
What owners like and dislike about strata
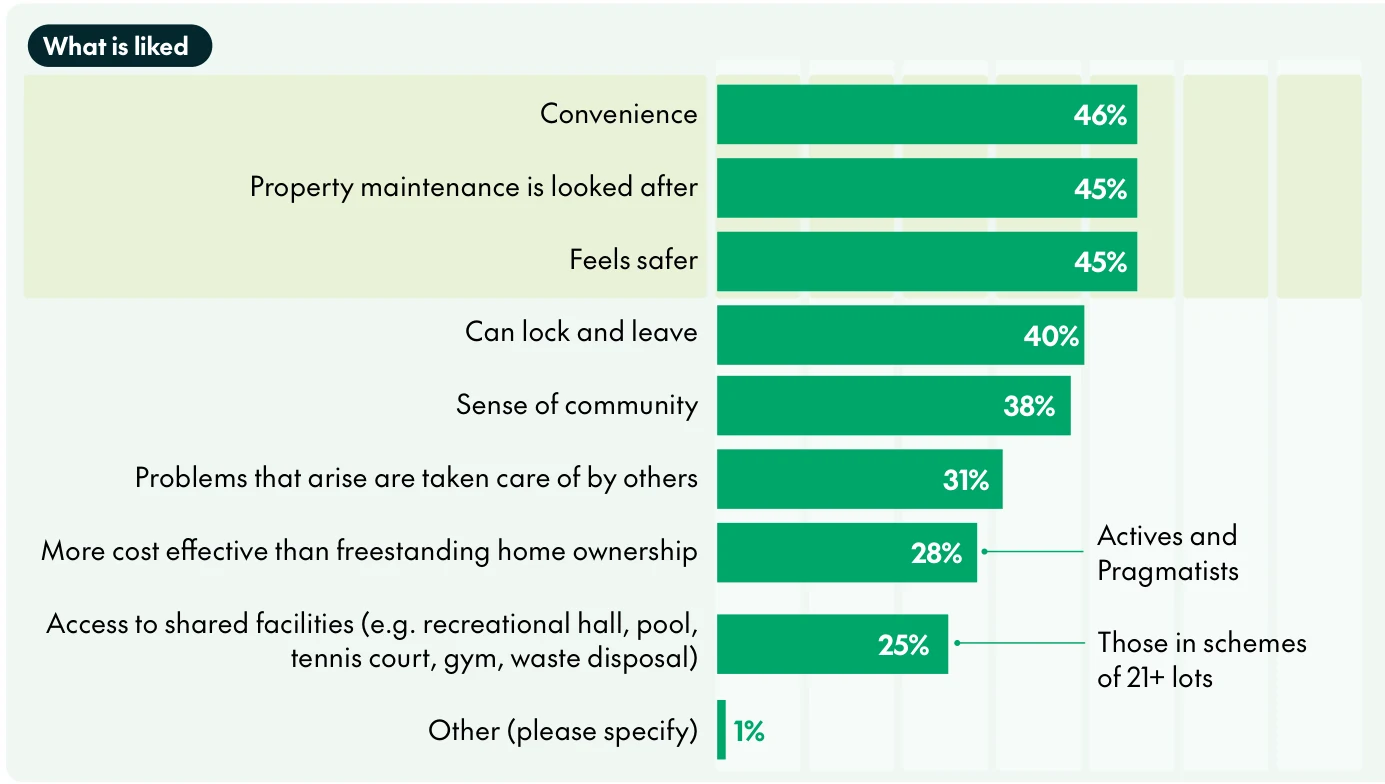
Figure 1.5: What owners like about strata living.
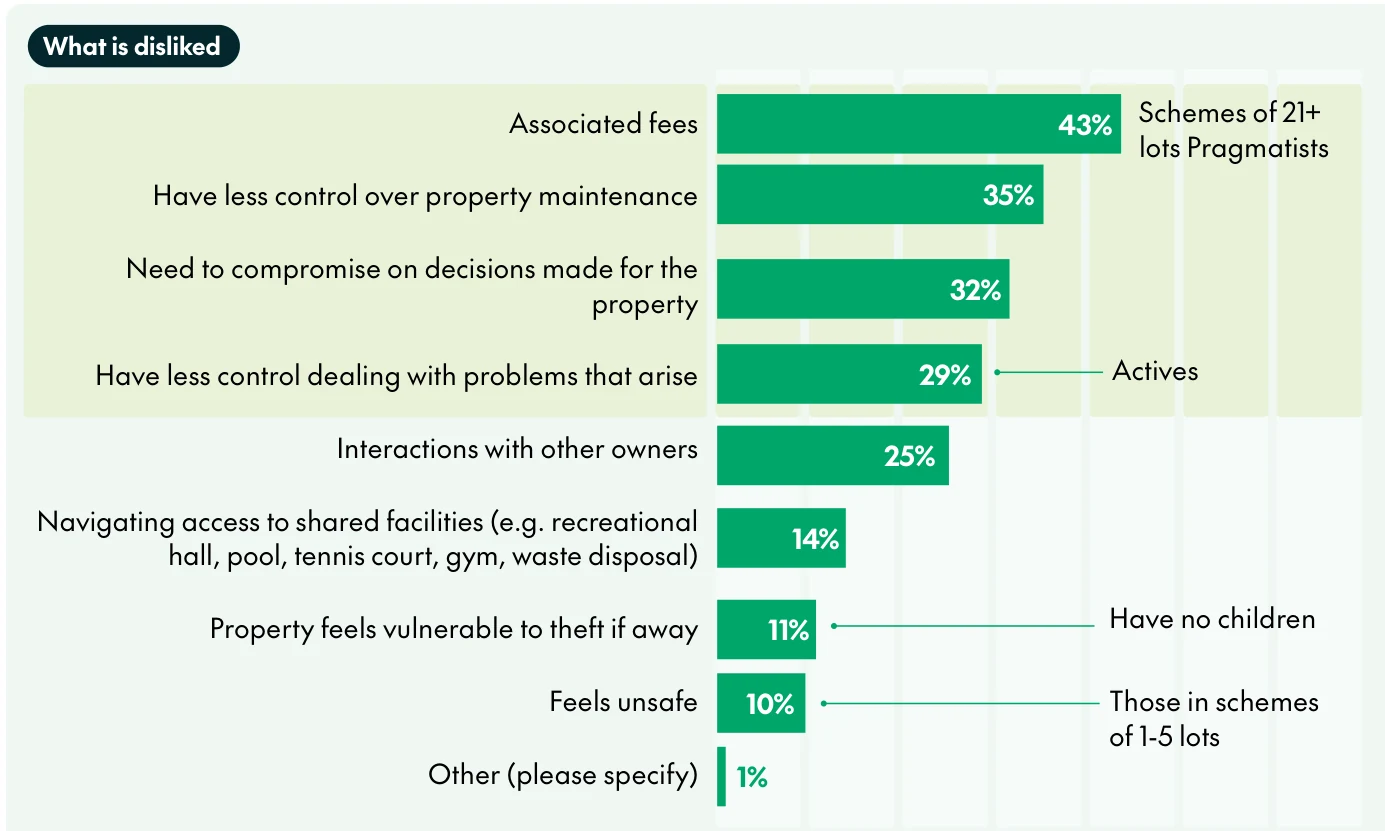
Figure 1.6: What owners dislike about strata living.
Put these two charts side by side and you can see the trade most owners make. They like that maintenance is handled by someone else (45%). They dislike having less control over it (35%). It's the same arrangement, liked and disliked by the same people.
Fees top the dislike list at 43%, and they peak in schemes of 21 or more lots. Only 25% name interactions with other owners as a dislike. Neighbours are less of a problem than the levy notice.
Three types of owner
The 2026 Index sorts owners into three groups. CHU calls them Actives, Pragmatists and Disengaged. It doesn't say what share of owners falls into each group, which makes the segment charts harder to weigh.
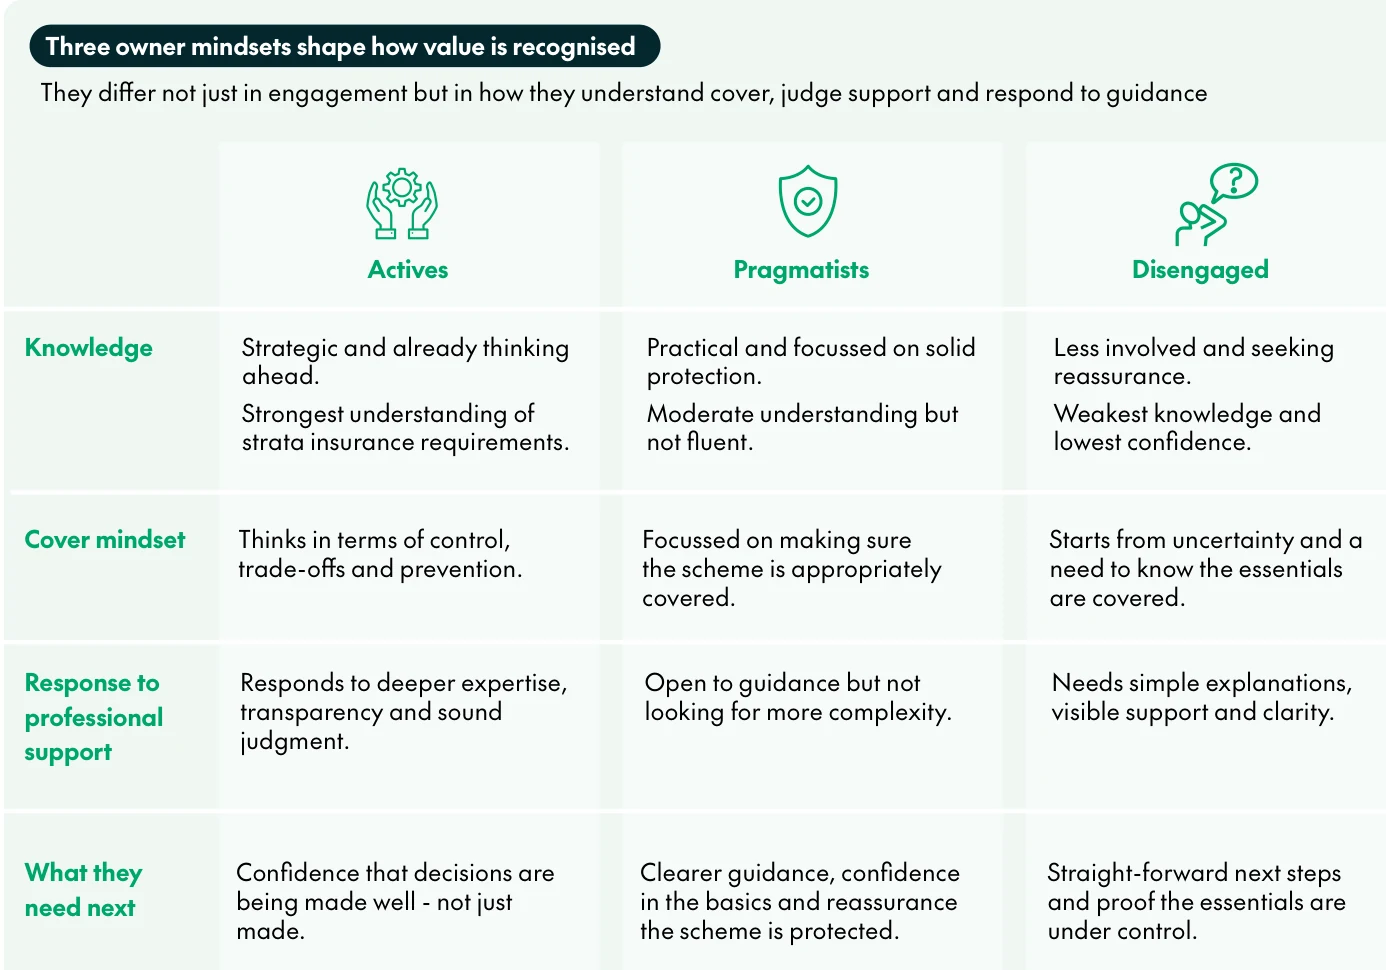
Figure 2.1: CHU's three owner mindsets.
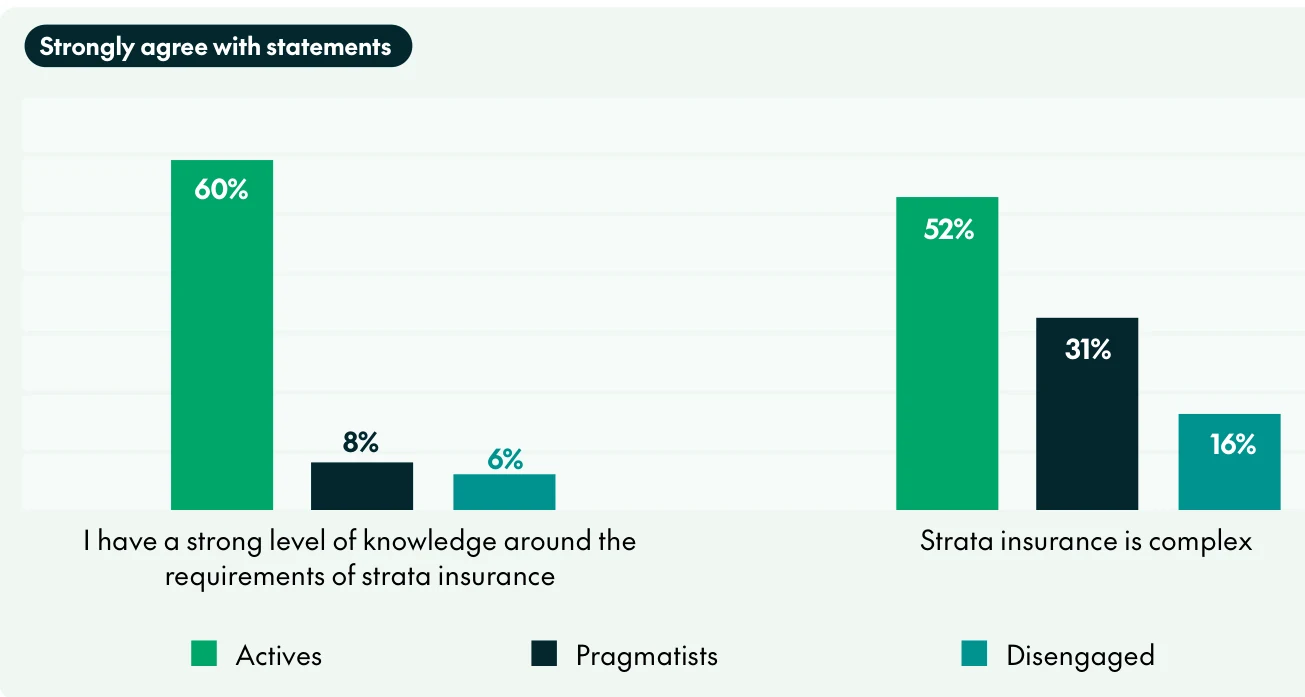
Figure 2.2: Self-rated knowledge of strata insurance, and whether owners think it's complex.
The pattern in Figure 2.2 is familiar to anyone who has sat on a committee. The owners who know the most are the ones most likely to say strata insurance is complex, at 52%. Among Disengaged owners only 16% say it is. They don't know enough to see the complexity.
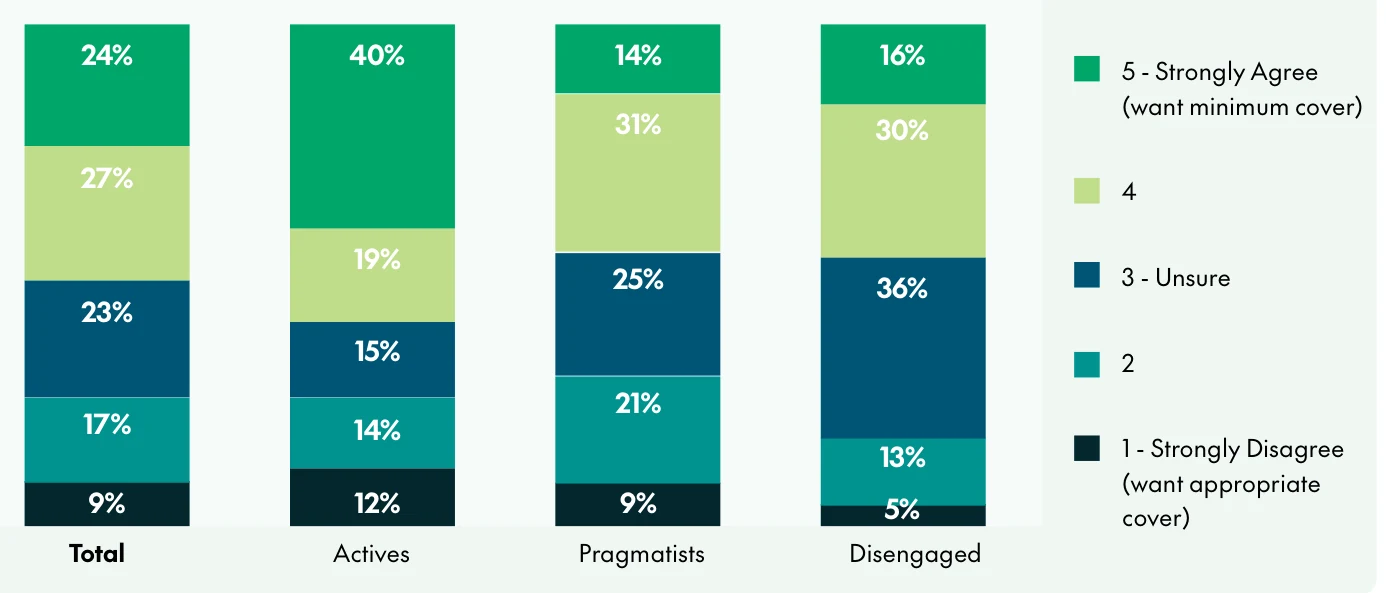
Figure 2.3: Agreement with "I want minimum cover when it comes to strata insurance".
This chart says more than the report draws out of it. Add the top two boxes and 51% of all owners agree they want minimum cover. Only 26% disagree. The best-informed group leans hardest towards it. 59% of Actives agree, 40% of them strongly.
CHU reads this as Actives being comfortable trading cover for good risk management. That may be true. But "minimum cover" needs care. In NSW and Victoria the owners corporation has to insure the building for its full replacement value, and the other states have similar rules. The legal floor is already a full rebuild. The room to go "minimum" is in optional extras, excess levels and sums insured for things like public liability and office bearers' cover. If owners hear "minimum" as a lower building sum insured, that is how buildings end up underinsured.
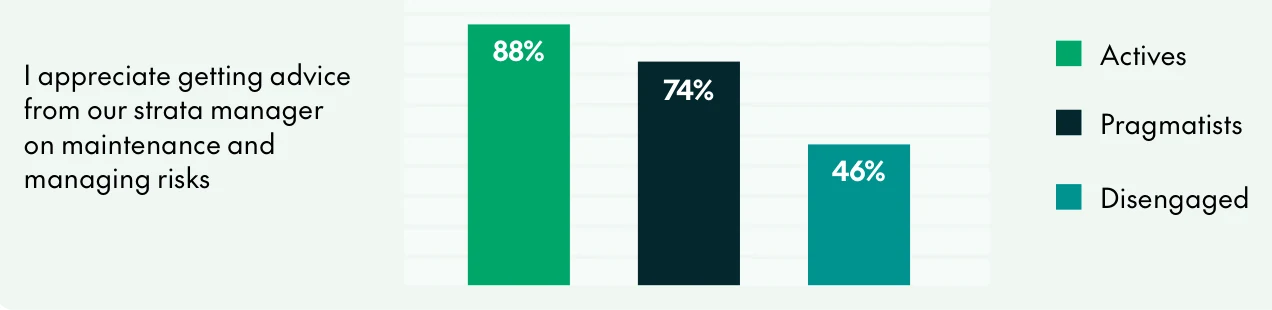
Figure 2.4: Owners who would appreciate advice on maintenance and managing risk.
A note on this one. The figure title in the report says advice "from our strata insurer", but the label on the chart says "from our strata manager". The text says Disengaged owners are "less than half the level" of Actives. 46% is a bit over half of 88%. Either way, the owners who most need the advice are the least interested in getting it.
Insurance brokers: trusted, but few owners know what they do
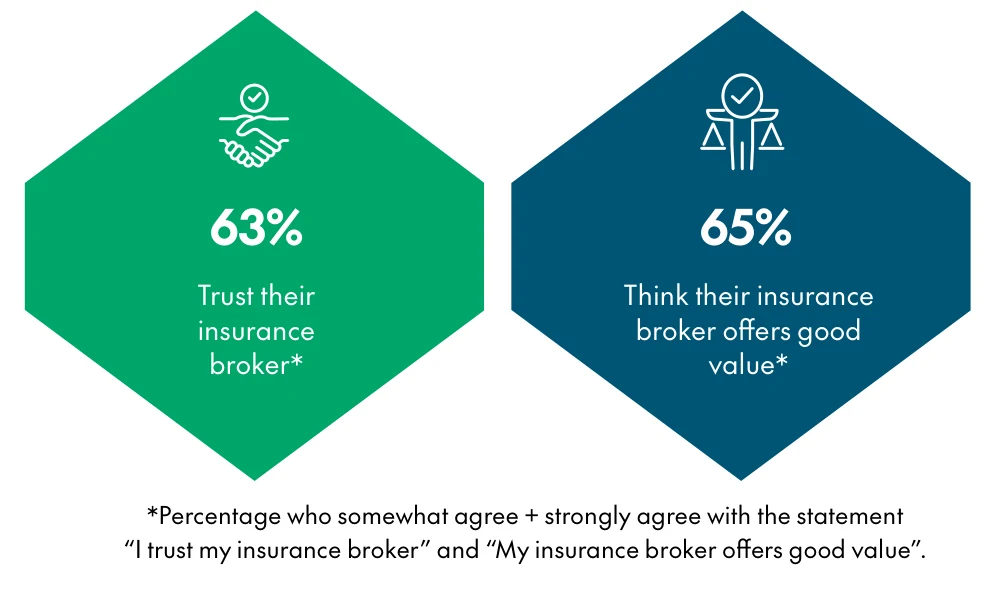
Figure 3.1: Trust in brokers and how owners rate their value.
About two in three owners trust their broker and think the broker is good value. The other third is where CHU sees a problem.
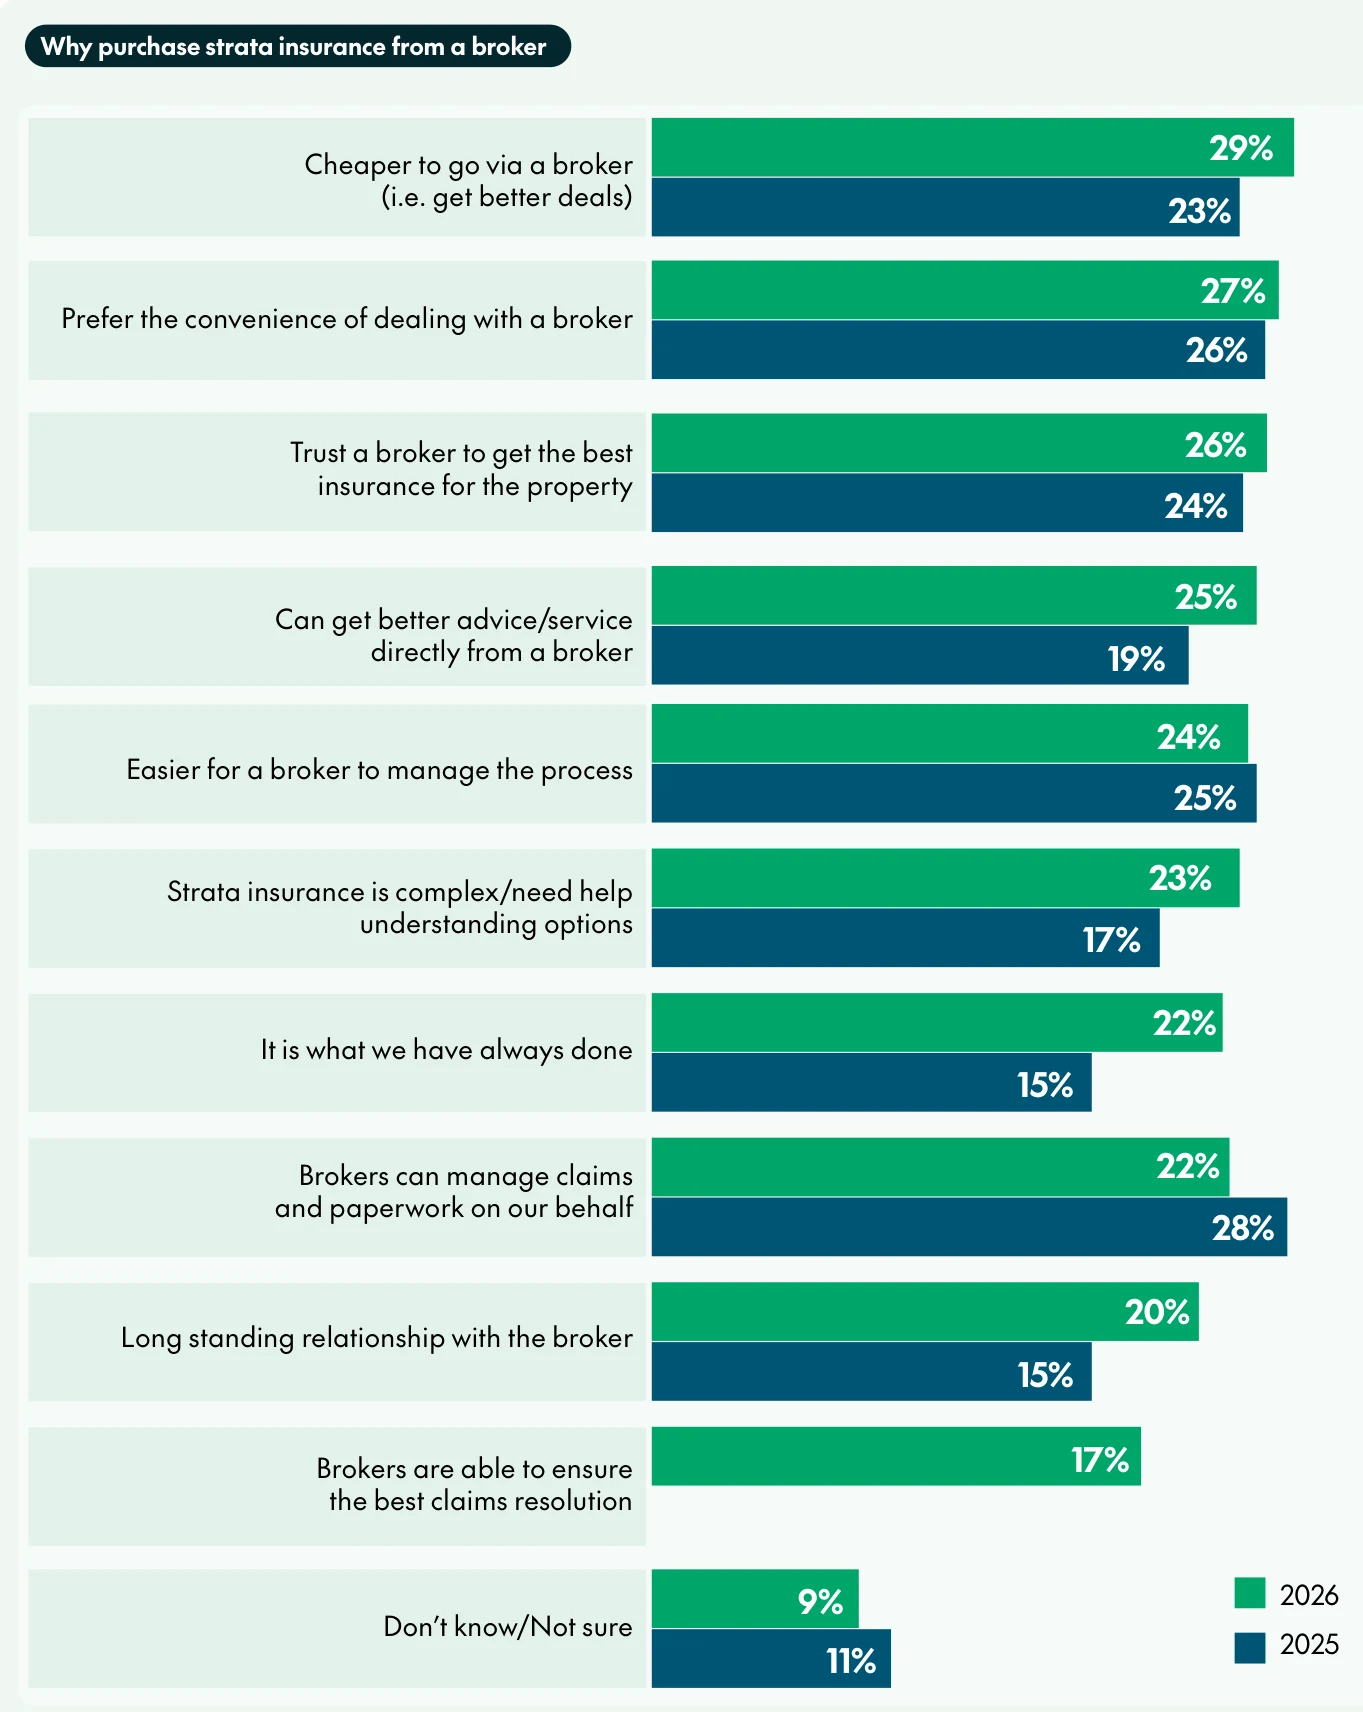
Figure 3.2: Why owners buy strata insurance through a broker, 2026 and 2025.
The biggest rise is "cheaper to go via a broker", up from 23% to 29%. The biggest fall is "brokers can manage claims and paperwork", down from 28% to 22%. Claims handling is where a broker earns the commission, so that drop is worth watching. 22% use a broker because "it is what we have always done", up from 15%.
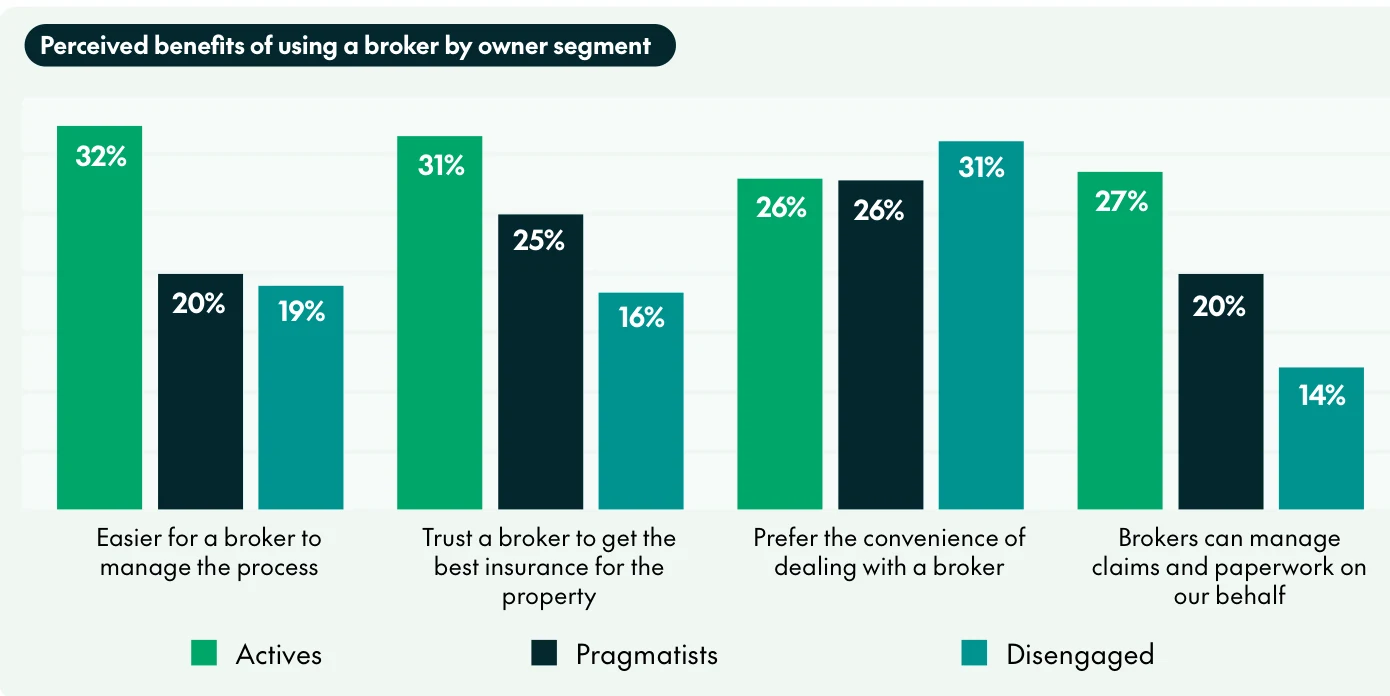
Figure 3.3: Top four reasons to use a broker, by owner segment.
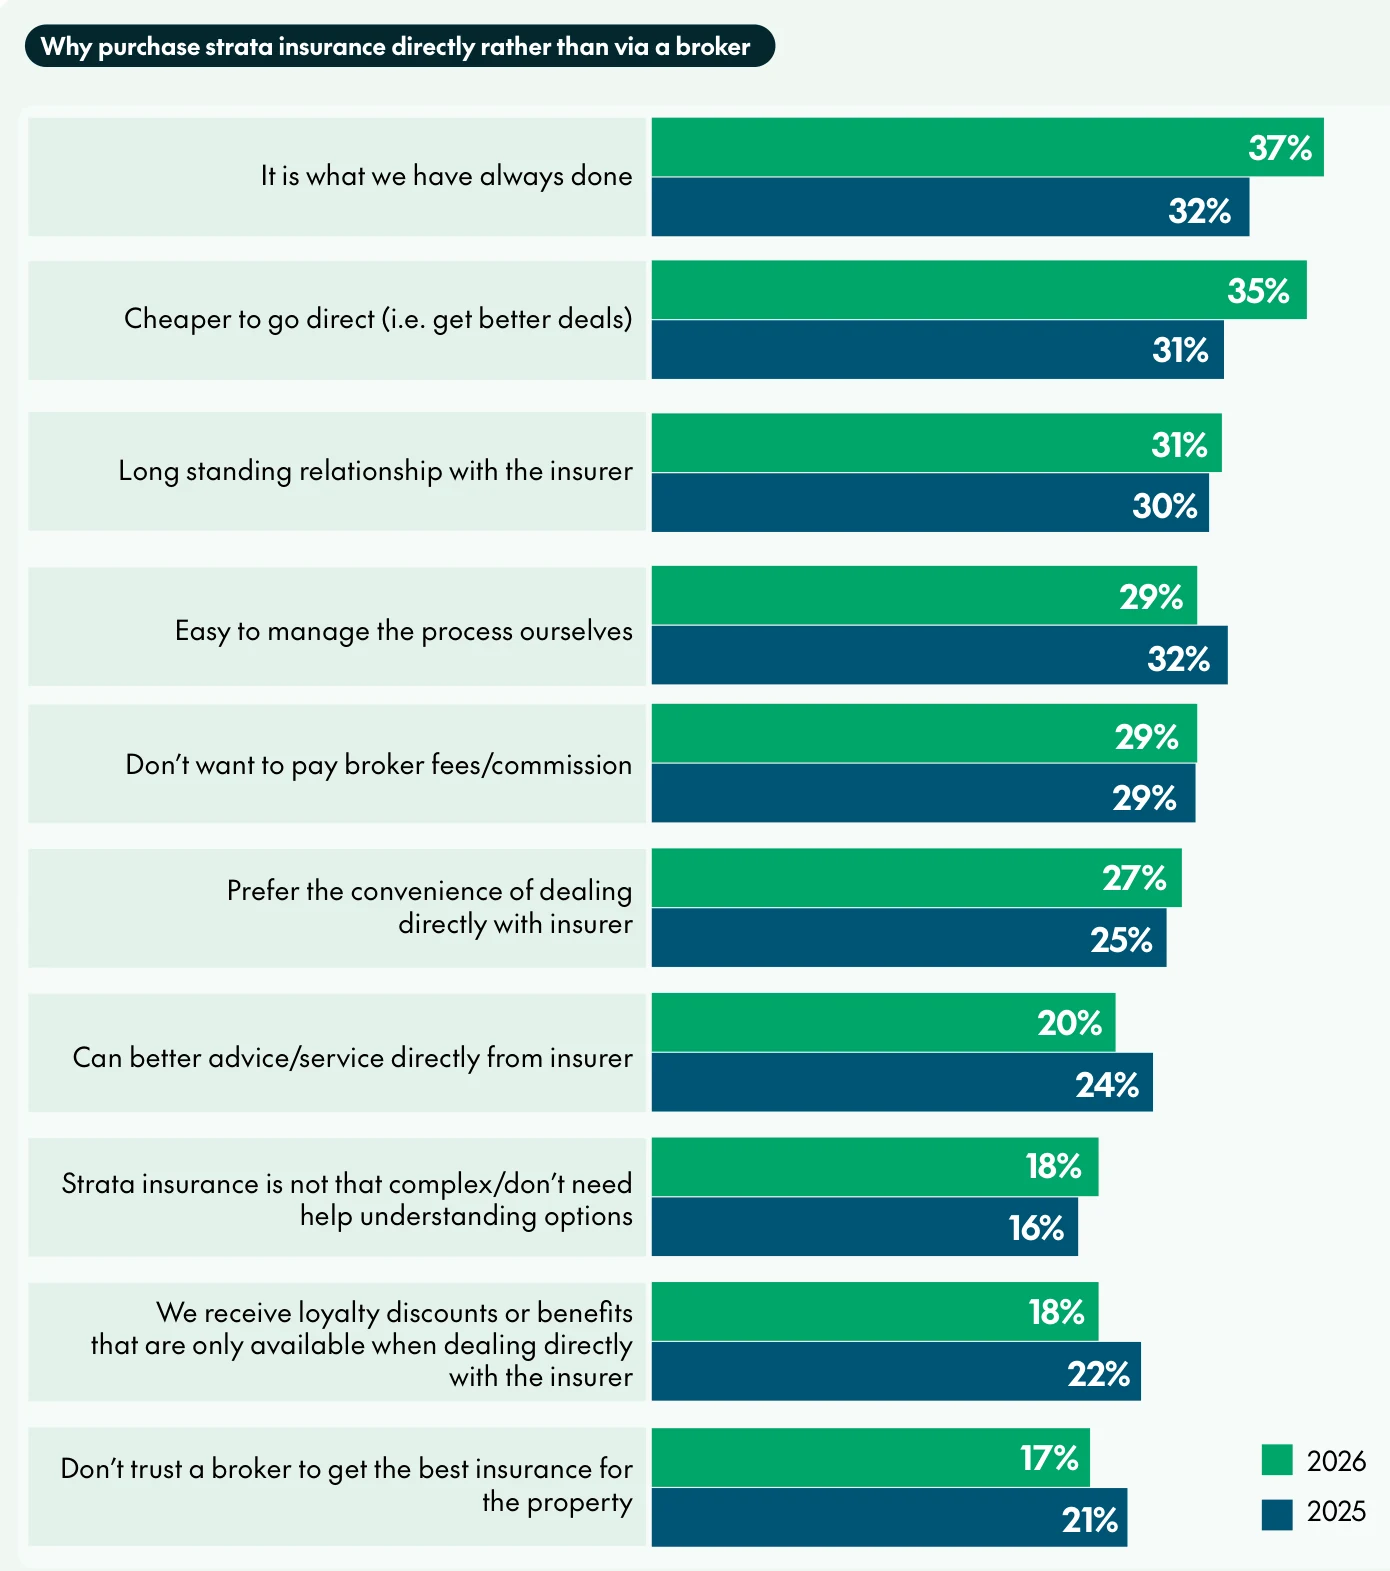
Figure 3.4: Why owners buy direct instead of through a broker, 2026 and 2025.
Habit is the top reason on both sides. 22% of broker buyers use one because they always have, and 37% of direct buyers go direct for the same reason. 35% of direct buyers think going direct is cheaper, and 29% of broker buyers think the broker is cheaper. Both can't be true for every building. The only way to know for your building is to compare the full premium, including commission, fees and the excess.
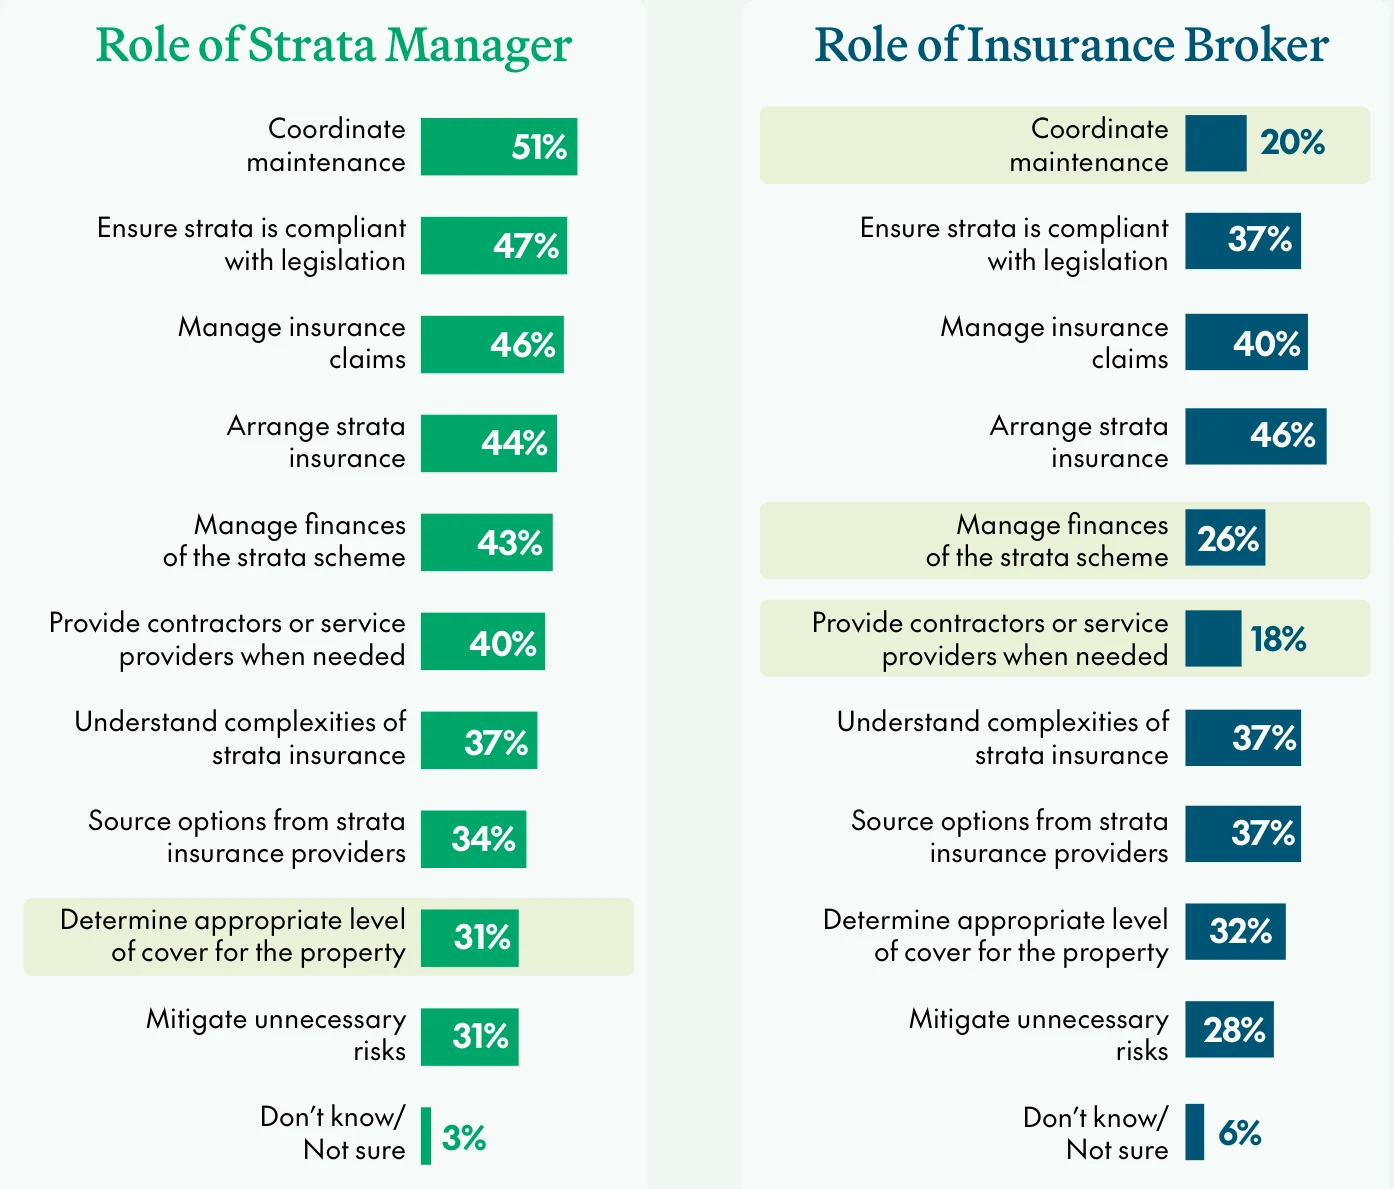
Figure 3.5: What owners think a strata manager does, against what a broker does.
This is the most useful chart in the report for a committee. Look at the right-hand side. 20% of owners think the broker coordinates maintenance. 26% think the broker manages the scheme's finances. 18% think the broker supplies contractors. A broker does none of those things.
The left-hand side is just as revealing. Only 51% think the strata manager coordinates maintenance, and only 43% think the manager handles the finances. Arranging insurance gets almost the same score for both roles, 44% and 46%. Many owners have no clear picture of who is responsible for what, which makes it hard to judge whether anyone is doing their job.
Strata managers: rated on what owners can see
Two-thirds of the schemes surveyed have a strata manager, and 70% of those owners are satisfied with them.
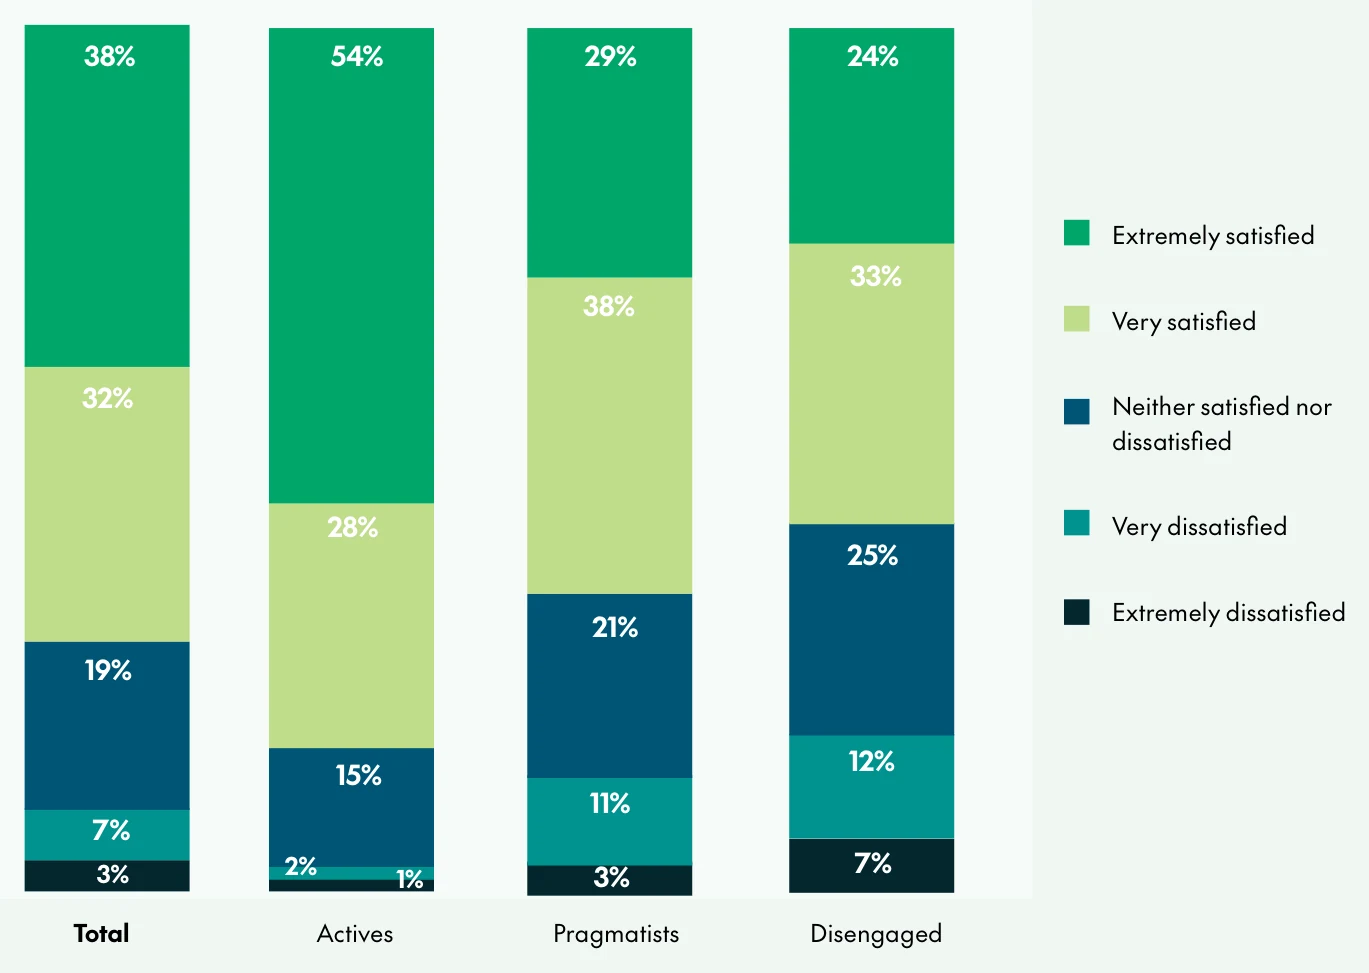
Figure 3.6: Satisfaction with the strata manager, by owner segment.
Actives are the happiest at 82%. Disengaged owners are the least happy at 57%. The report's text gives Pragmatists as 65%. The bars add to 67%. Rounding probably explains it.
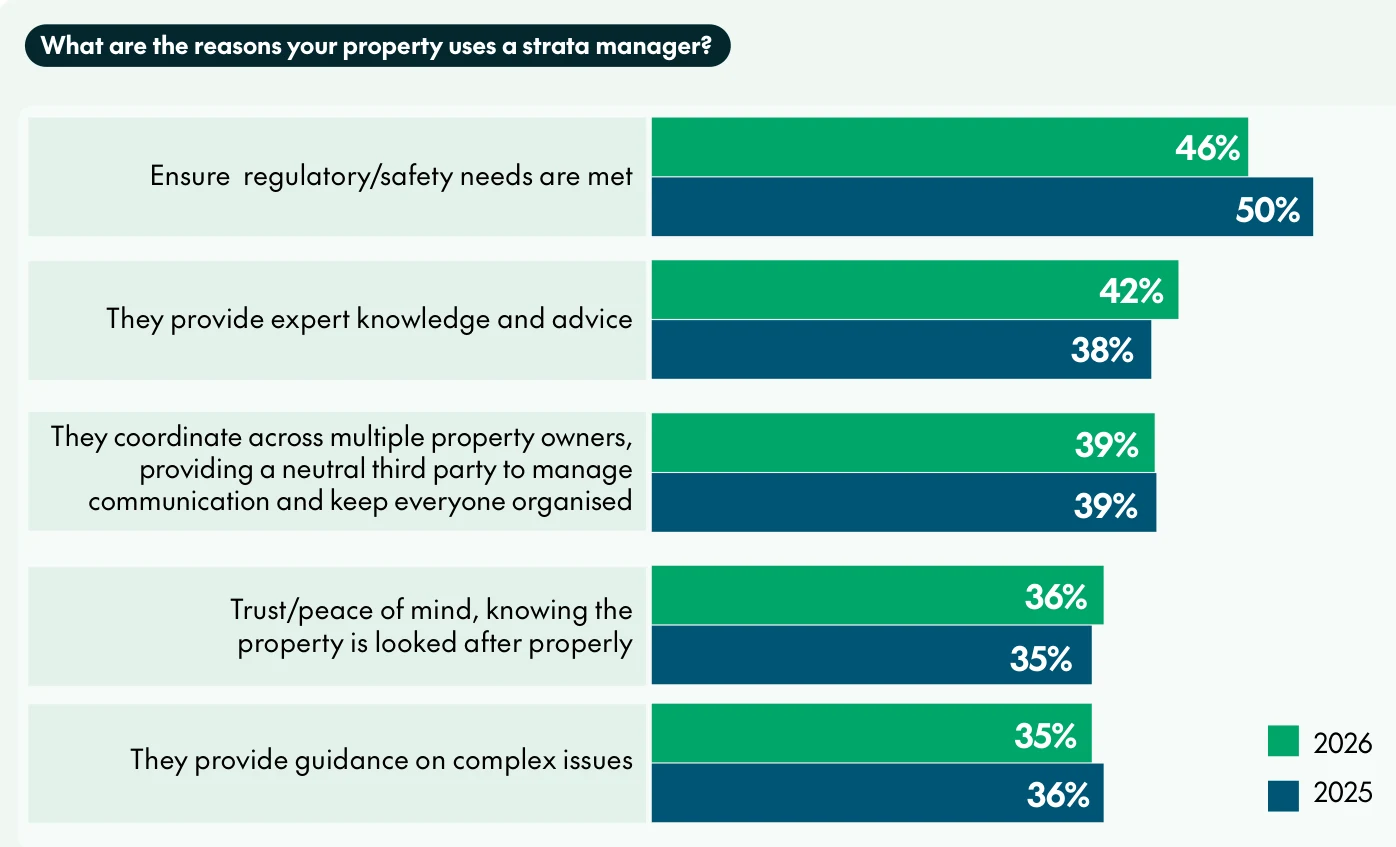
Figure 3.7: Top five reasons for using a strata manager, 2026 and 2025.
Compliance is still the top reason to hire a manager, though it fell from 50% to 46%. Expert advice rose from 38% to 42%. Very little else moved.
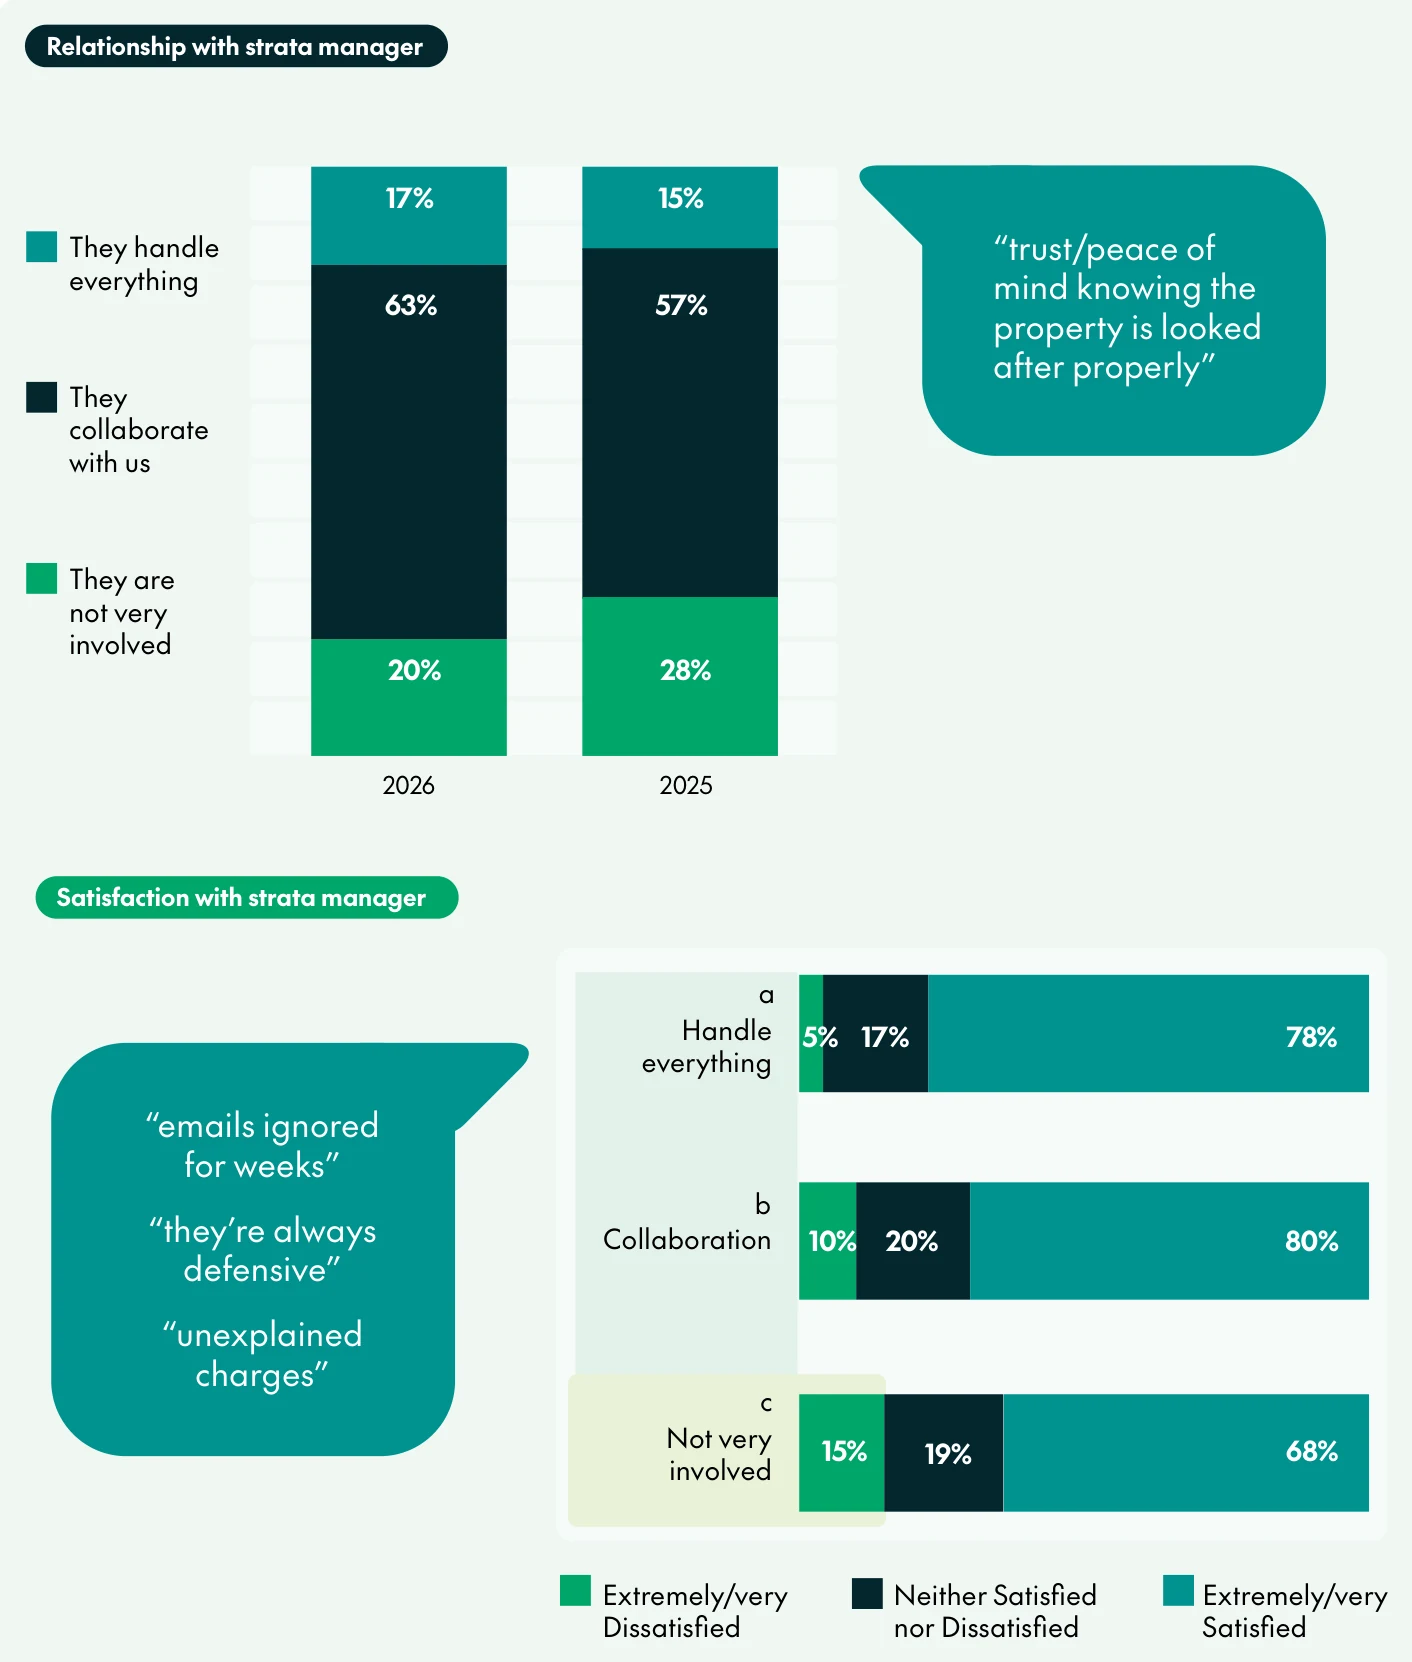
Figure 3.8: Type of relationship with the strata manager, and satisfaction with each type.
63% of owners describe the relationship with their manager as collaborative, up from 57%. The share who say the manager is "not very involved" dropped from 28% to 20%. Satisfaction is highest where the manager collaborates with the committee, at 80%. Where the manager handles everything, it's 78%. Where the manager is not very involved, it's 68%, and 15% are dissatisfied.
The owner quotes printed on the chart are the complaints every committee has heard. "Emails ignored for weeks." "They're always defensive." "Unexplained charges."
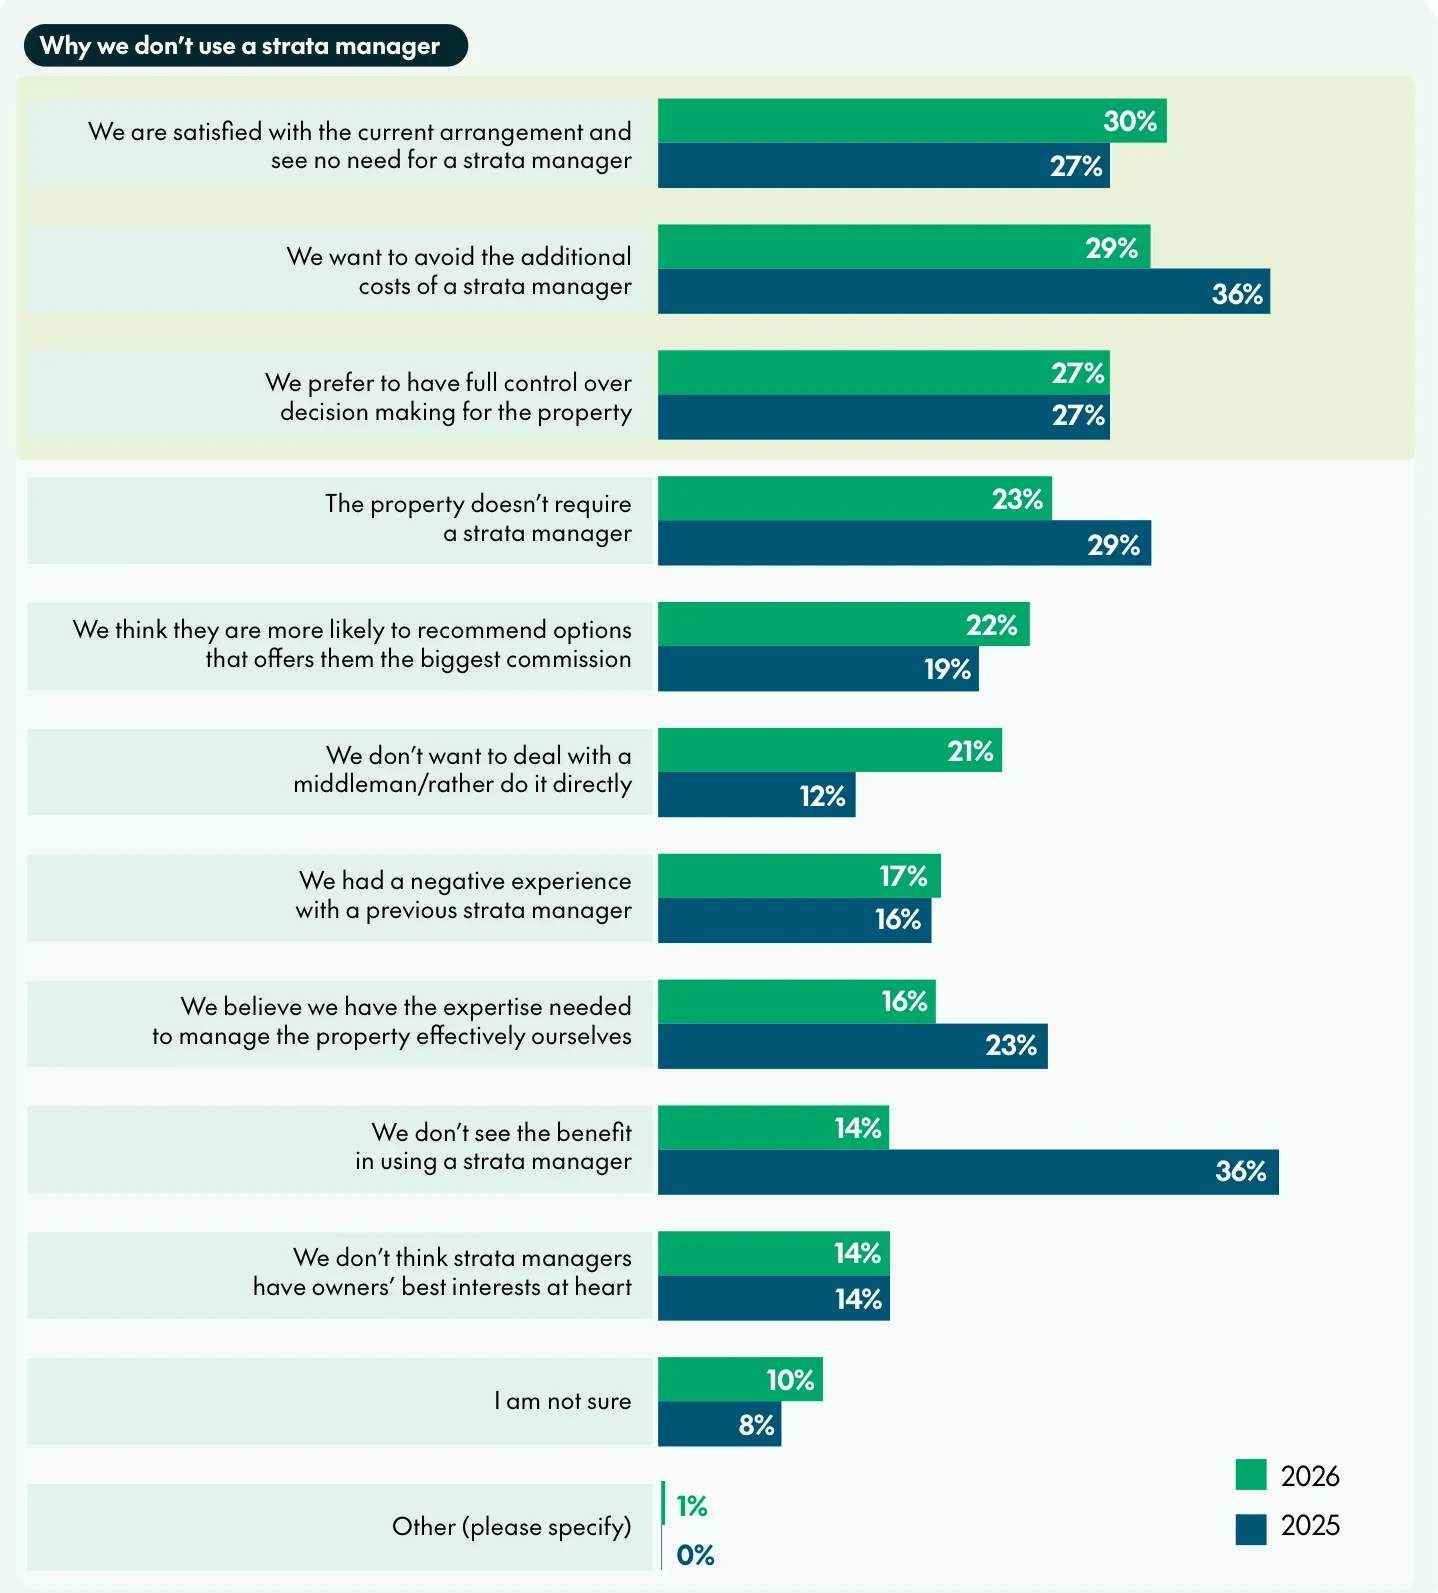
Figure 3.9: Why self-managed schemes don't use a strata manager, 2026 and 2025.
The 2025 to 2026 movements here are large. "We don't see the benefit" fell from 36% to 14%. "We don't want to deal with a middleman" rose from 12% to 21%. CHU doesn't say how many self-managed schemes were in the sample, and it's probably small. A swing that size in a small group can be noise. The stable answers are more reliable. About 27% to 30% of self-managed owners are happy with their arrangement and want to keep control.
What builds trust, and what breaks it
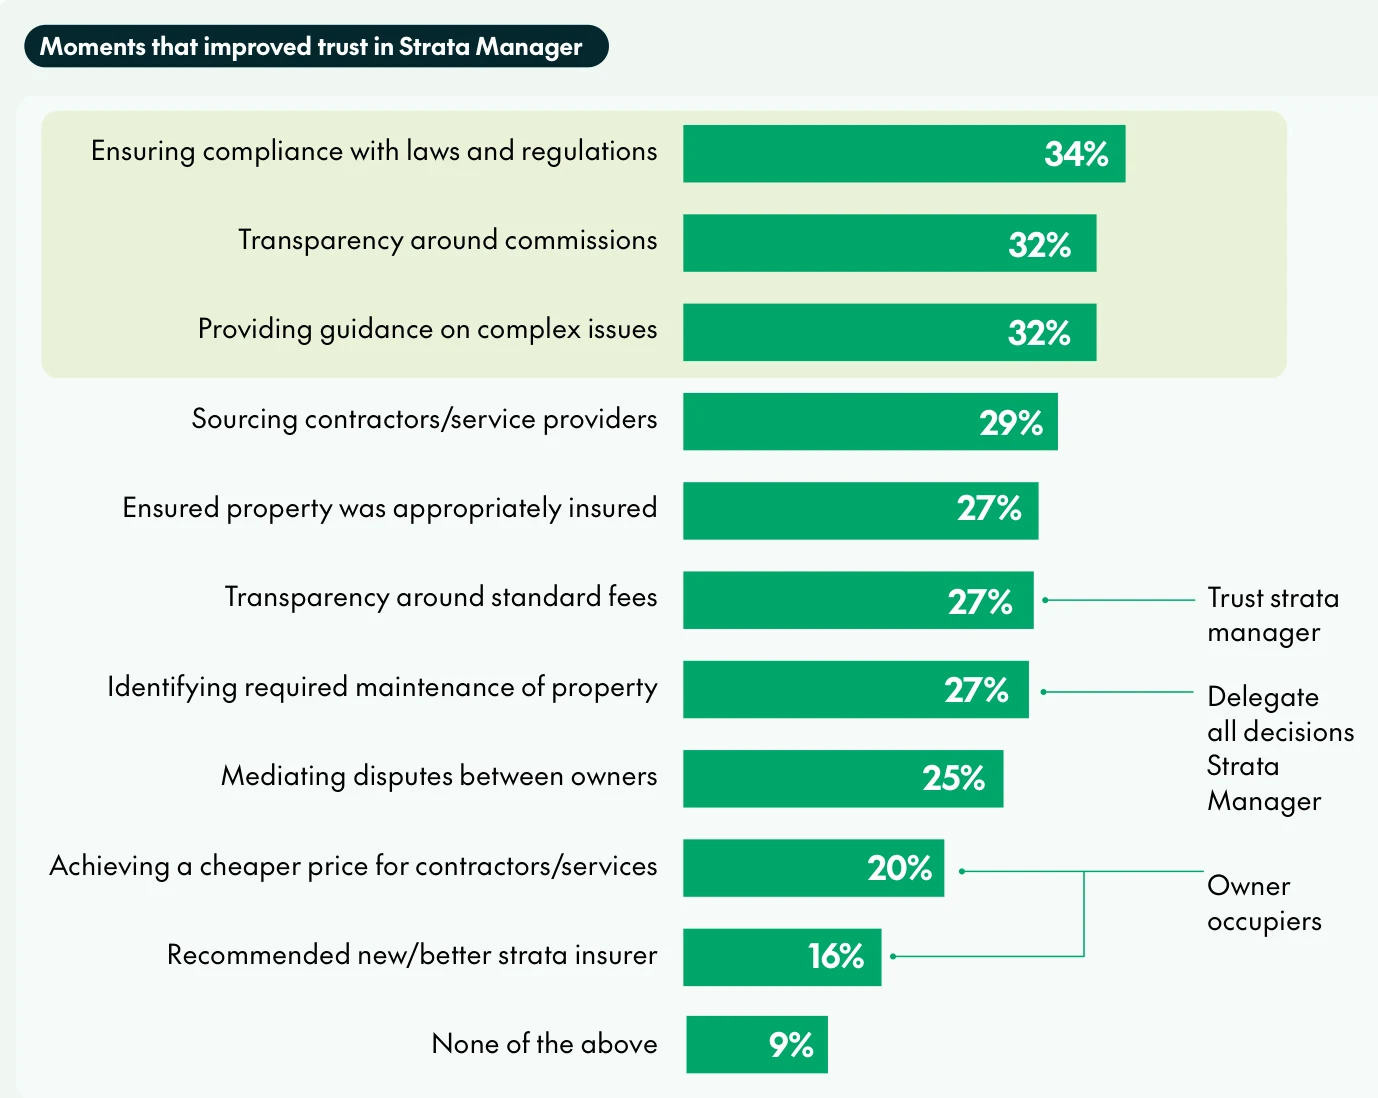
Figure 3.10: What improved owners' trust in their strata manager.
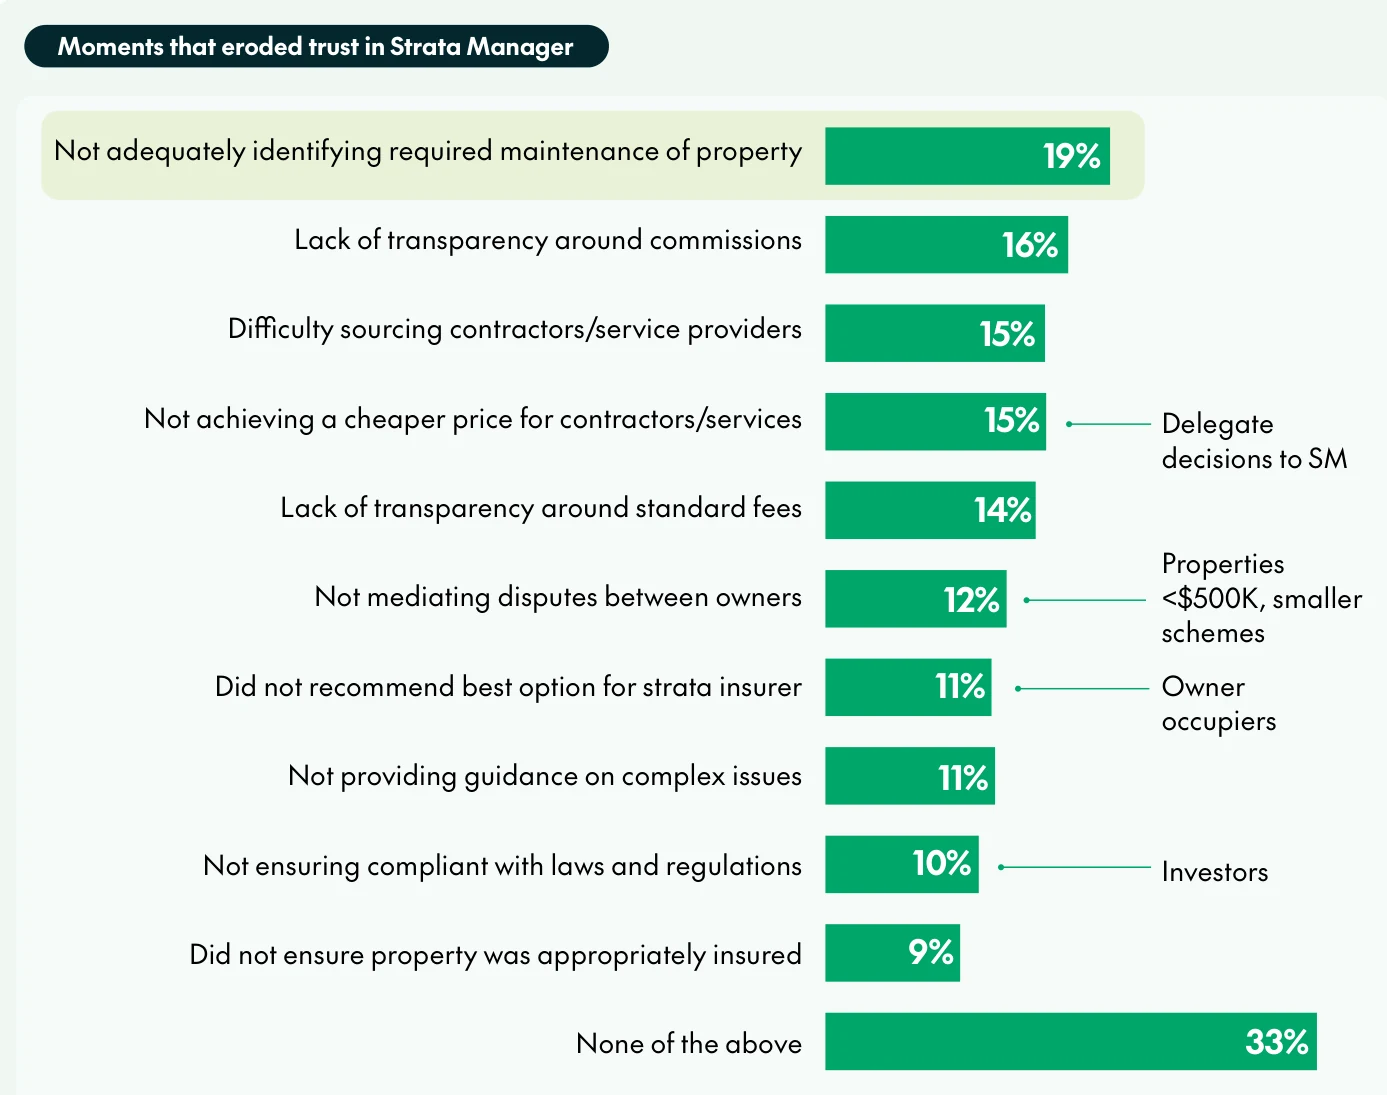
Figure 3.11: What eroded owners' trust in their strata manager.
Commission transparency appears near the top of both lists, 32% for building trust and 16% for losing it. That fits with the reforms on strata manager commissions in NSW and elsewhere. Owners notice when a manager is upfront about what they earn from the insurance placement.
Missing maintenance is the top trust-breaker, at 19%. A third of owners say nothing has eroded their trust, which is a better result than the industry's reputation would suggest.

Figure 3.12: How often owners want to hear from their strata manager.
This is the finding CHU calls surprising. 64% of owners want to hear from their strata manager more often. A quarter want much more. Only about 8% want less.
It doesn't have to mean more email. A short update after each committee meeting, saying what was decided, what work is booked and what it costs, would cover most of what owners say is missing.
Confidence in the sum insured
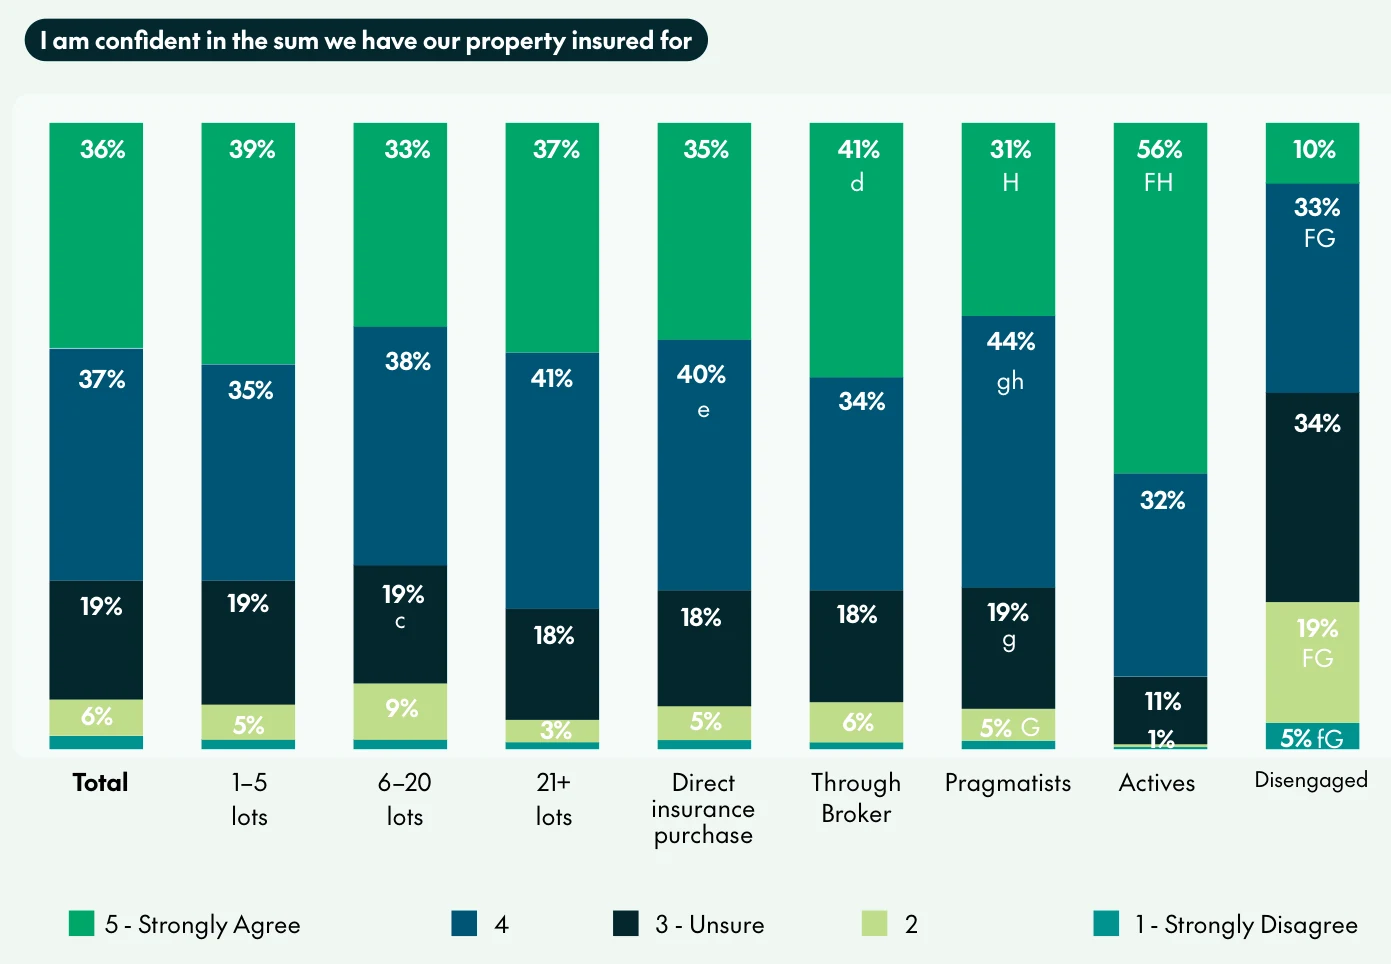
Figure 3.13: Agreement with "I am confident in the sum we have our property insured for".
CHU says confidence in the sum insured is the single biggest driver of satisfaction with an insurer. Overall, 73% are confident. The figure barely changes with building size or with how the insurance was bought. Broker and direct buyers both sit at 75%.
The difference is in the owner types. 88% of Actives are confident. Among Disengaged owners it's 43%, with 34% unsure and 24% not confident.
Being confident doesn't make the number right, though. The survey records how owners feel about the sum insured, not whether a valuer has checked it. If your building hasn't had an insurance valuation in the last few years, nobody knows whether the 73% is justified. Queensland bodies corporate must get a replacement valuation at least every five years. If your state sets no interval, five years is still a long time to go without one, given how fast construction costs have risen.
What a committee can take from this
The report is written for brokers and strata managers. Most of its findings apply to committees just as well.
- Get a maintenance plan if you don't have one. One scheme in three has none. Start with a schedule of regular inspections for common property and a budget for the year, and approve it as one item at the AGM.
- Approve the schedule, not every job. If committee disagreement is holding up maintenance, as 37% of owners say it is, give the manager authority to proceed with scheduled work up to an agreed amount.
- Write down who does what. Owners confuse the strata manager's role with the broker's. Put both on one page and send it to every owner: the manager's agency agreement duties, the broker's services and commission, and what the committee decides itself.
- Ask for the commission in writing. Commission transparency builds trust more than almost anything else on CHU's list. Ask the manager and the broker for every commission and fee on the insurance renewal before you approve it.
- Check the sum insured. Don't rely on feeling confident. Look at the date of the last valuation and get a new one if it's more than three to five years old or the building has had major work.
- Send a short update after every committee meeting. Most owners want to hear more. A few lines on decisions, upcoming work and costs is enough.
What UnitBuddy tracks
UnitBuddy keeps the maintenance schedule, inspection reports, insurance valuation, policy schedules and commission disclosures in one place against the building. Committees can set inspections and the valuation as dated tasks so they don't depend on someone remembering. Meeting decisions and updates go to every owner from the same record, which covers the communication gap the CHU survey found.
The CHU Strata Index 2026 shows a gap between how owners feel and what is in place. Most are satisfied with their strata manager and confident in their insurance. A third have no maintenance plan, and half can't say who does what. A committee can't fix how owners feel about strata. It can close the second gap with a plan, a one-page list of roles and a current valuation.
Sources and further reading
- CHU Strata Index 2026, CHU Underwriting Agencies, June 2026. Research conducted by Fuller.
- Strata Schemes Management Act 2015 (NSW), NSW Legislation
- Owners Corporations Act 2006 (Vic), Victorian Legislation
Keep the scheme file in one place the committee and the manager can both open. Features, pricing, or book a tour.